Risk
Calculating burn rates for an organisation’s group life insurance is a valuable way to gain insight as to how the cover has performed, where claims patterns have changed and what this may mean for future pricing.
These rates – which are the unit rate an insurer would have needed to charge to cover the cost of claims – are calculated by dividing the total claim amount for the scheme year by the total policy benefit.
This figure is then multiplied by 1,000 to give the rate per £1,000 of sum insured.
Some burn rates are calculated by dividing the number of claims by the number of lives covered and multiplying the result by 1,000 to get a burn rate. This is less sophisticated but is known as the burn rate by lives.
Burn rate calculation
Here’s an example of a burn rate calculation.
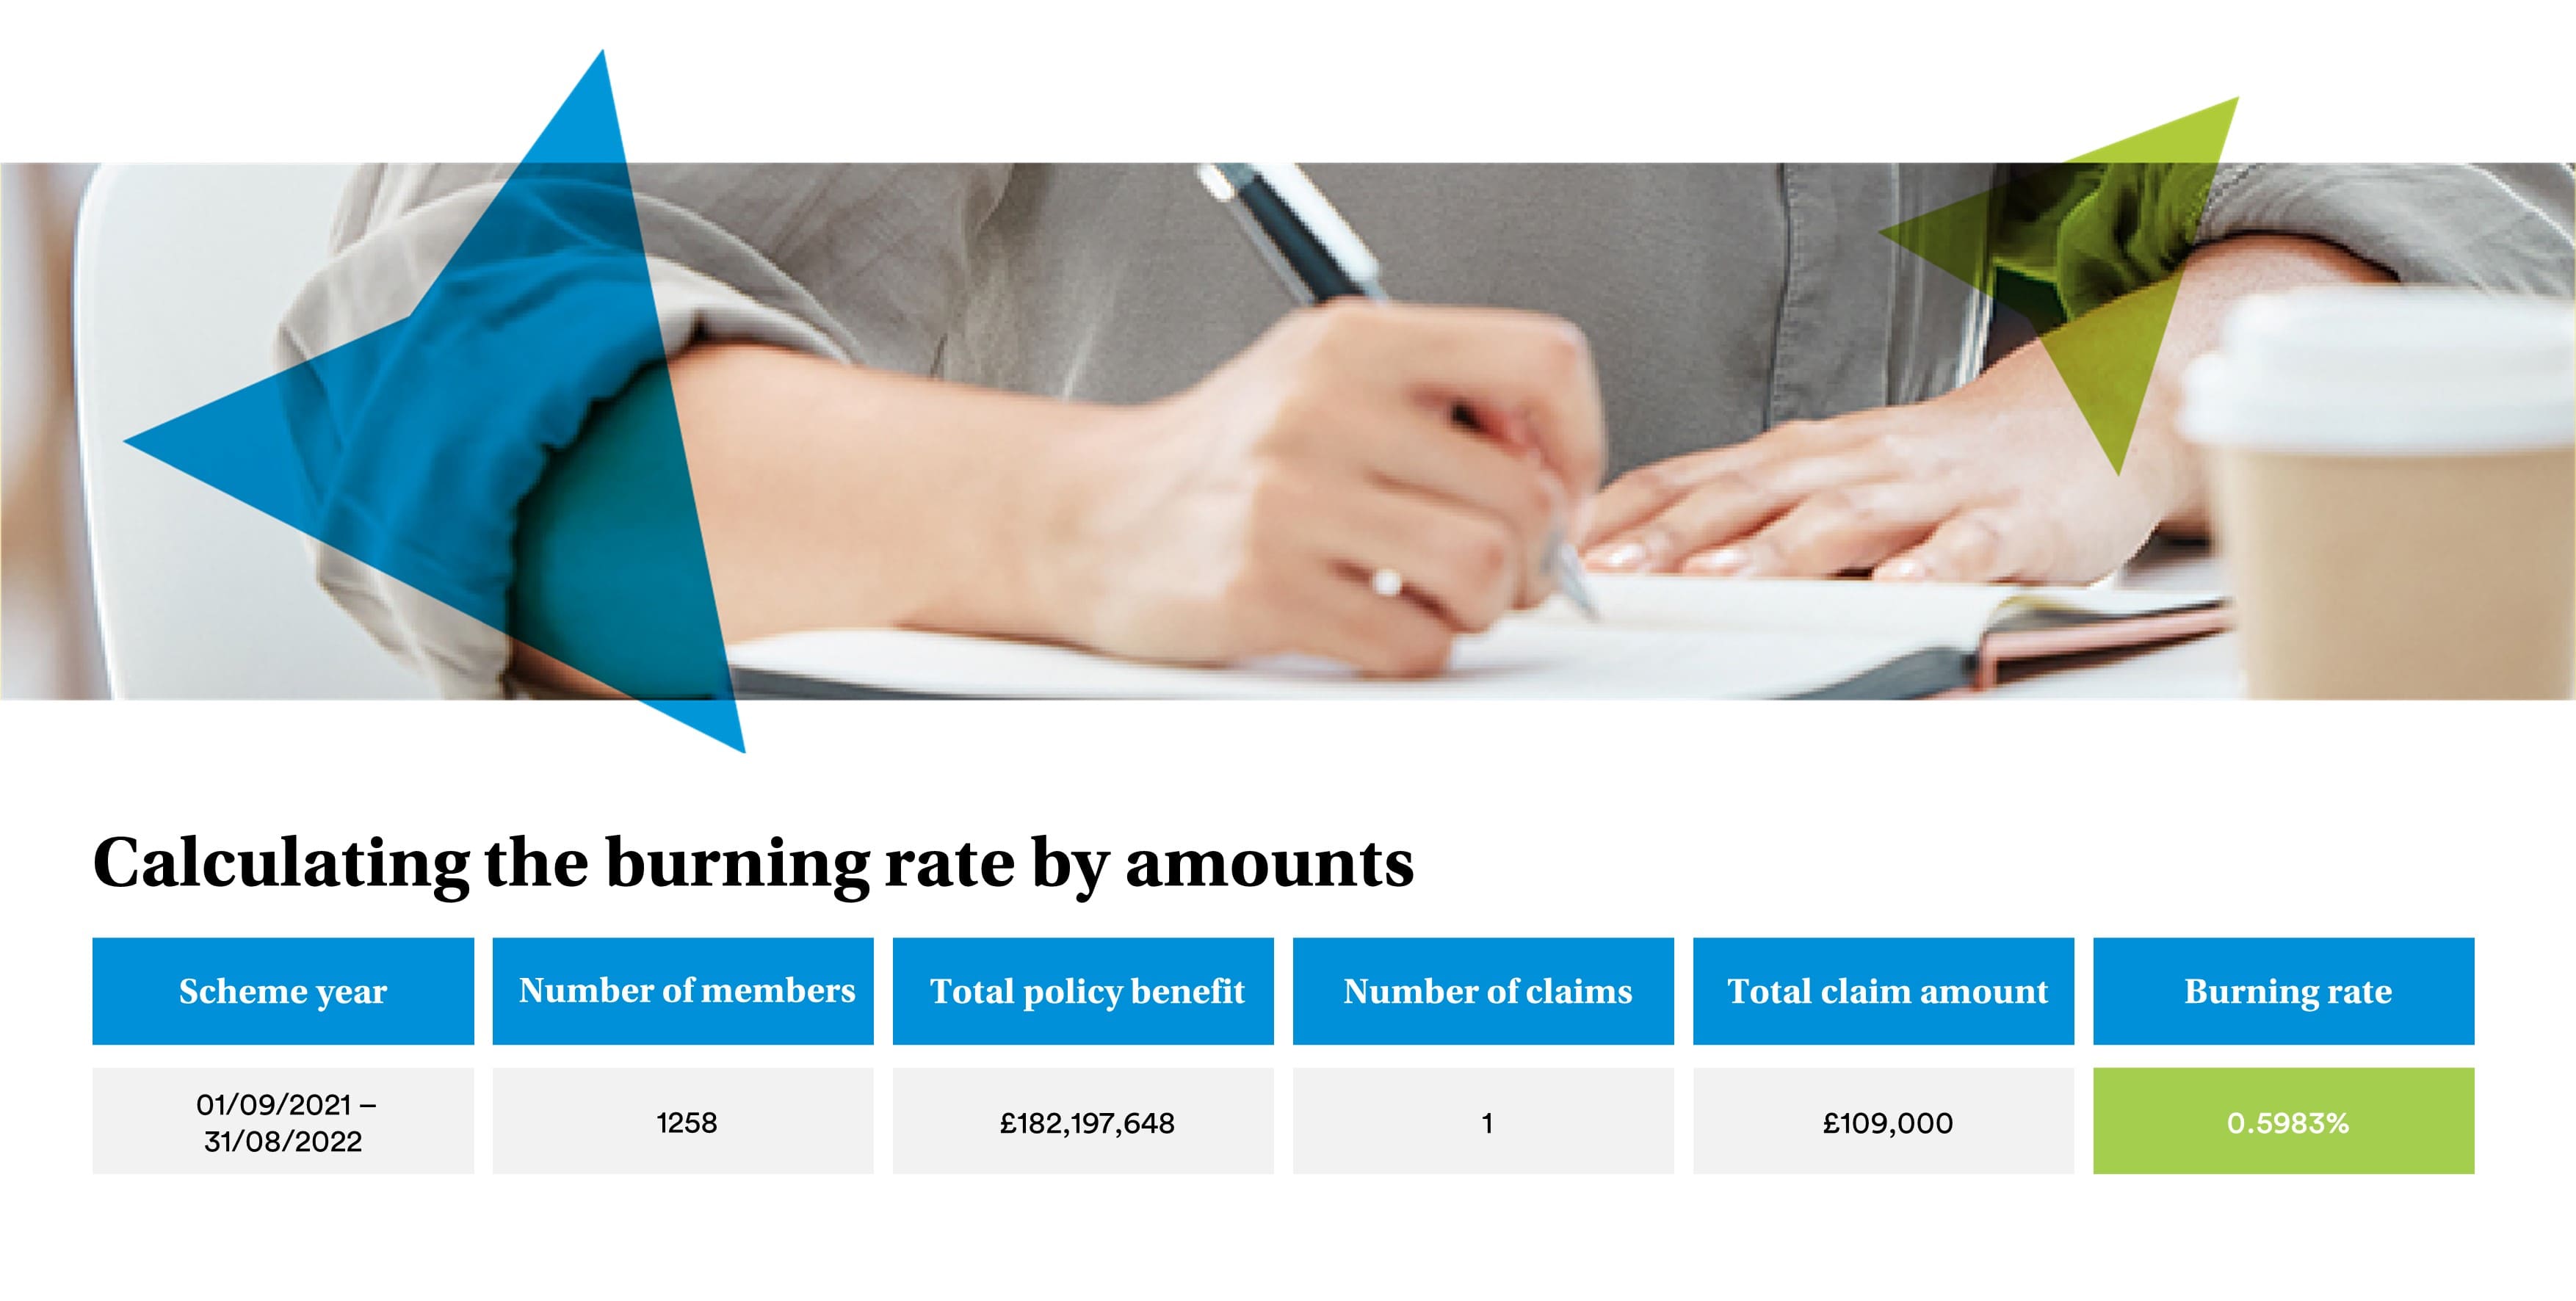
In 2021/2022, the total policy benefit was £182,197,648 and there was one claim for £109,000.
To get the burn rate, divide the total claim amount – £109,000 – by the total policy benefit – £182,197,648 – to get 0.00059825.
Then multiply it by 1,000 to get the percentage per mille (the symbol for which is ‰), or rate per £1,000 insured.
This gives a figure of £0.5983‰. This is the rate the insurer would have needed to charge per £1,000 to cover claims in 2021/22.
Performance insight
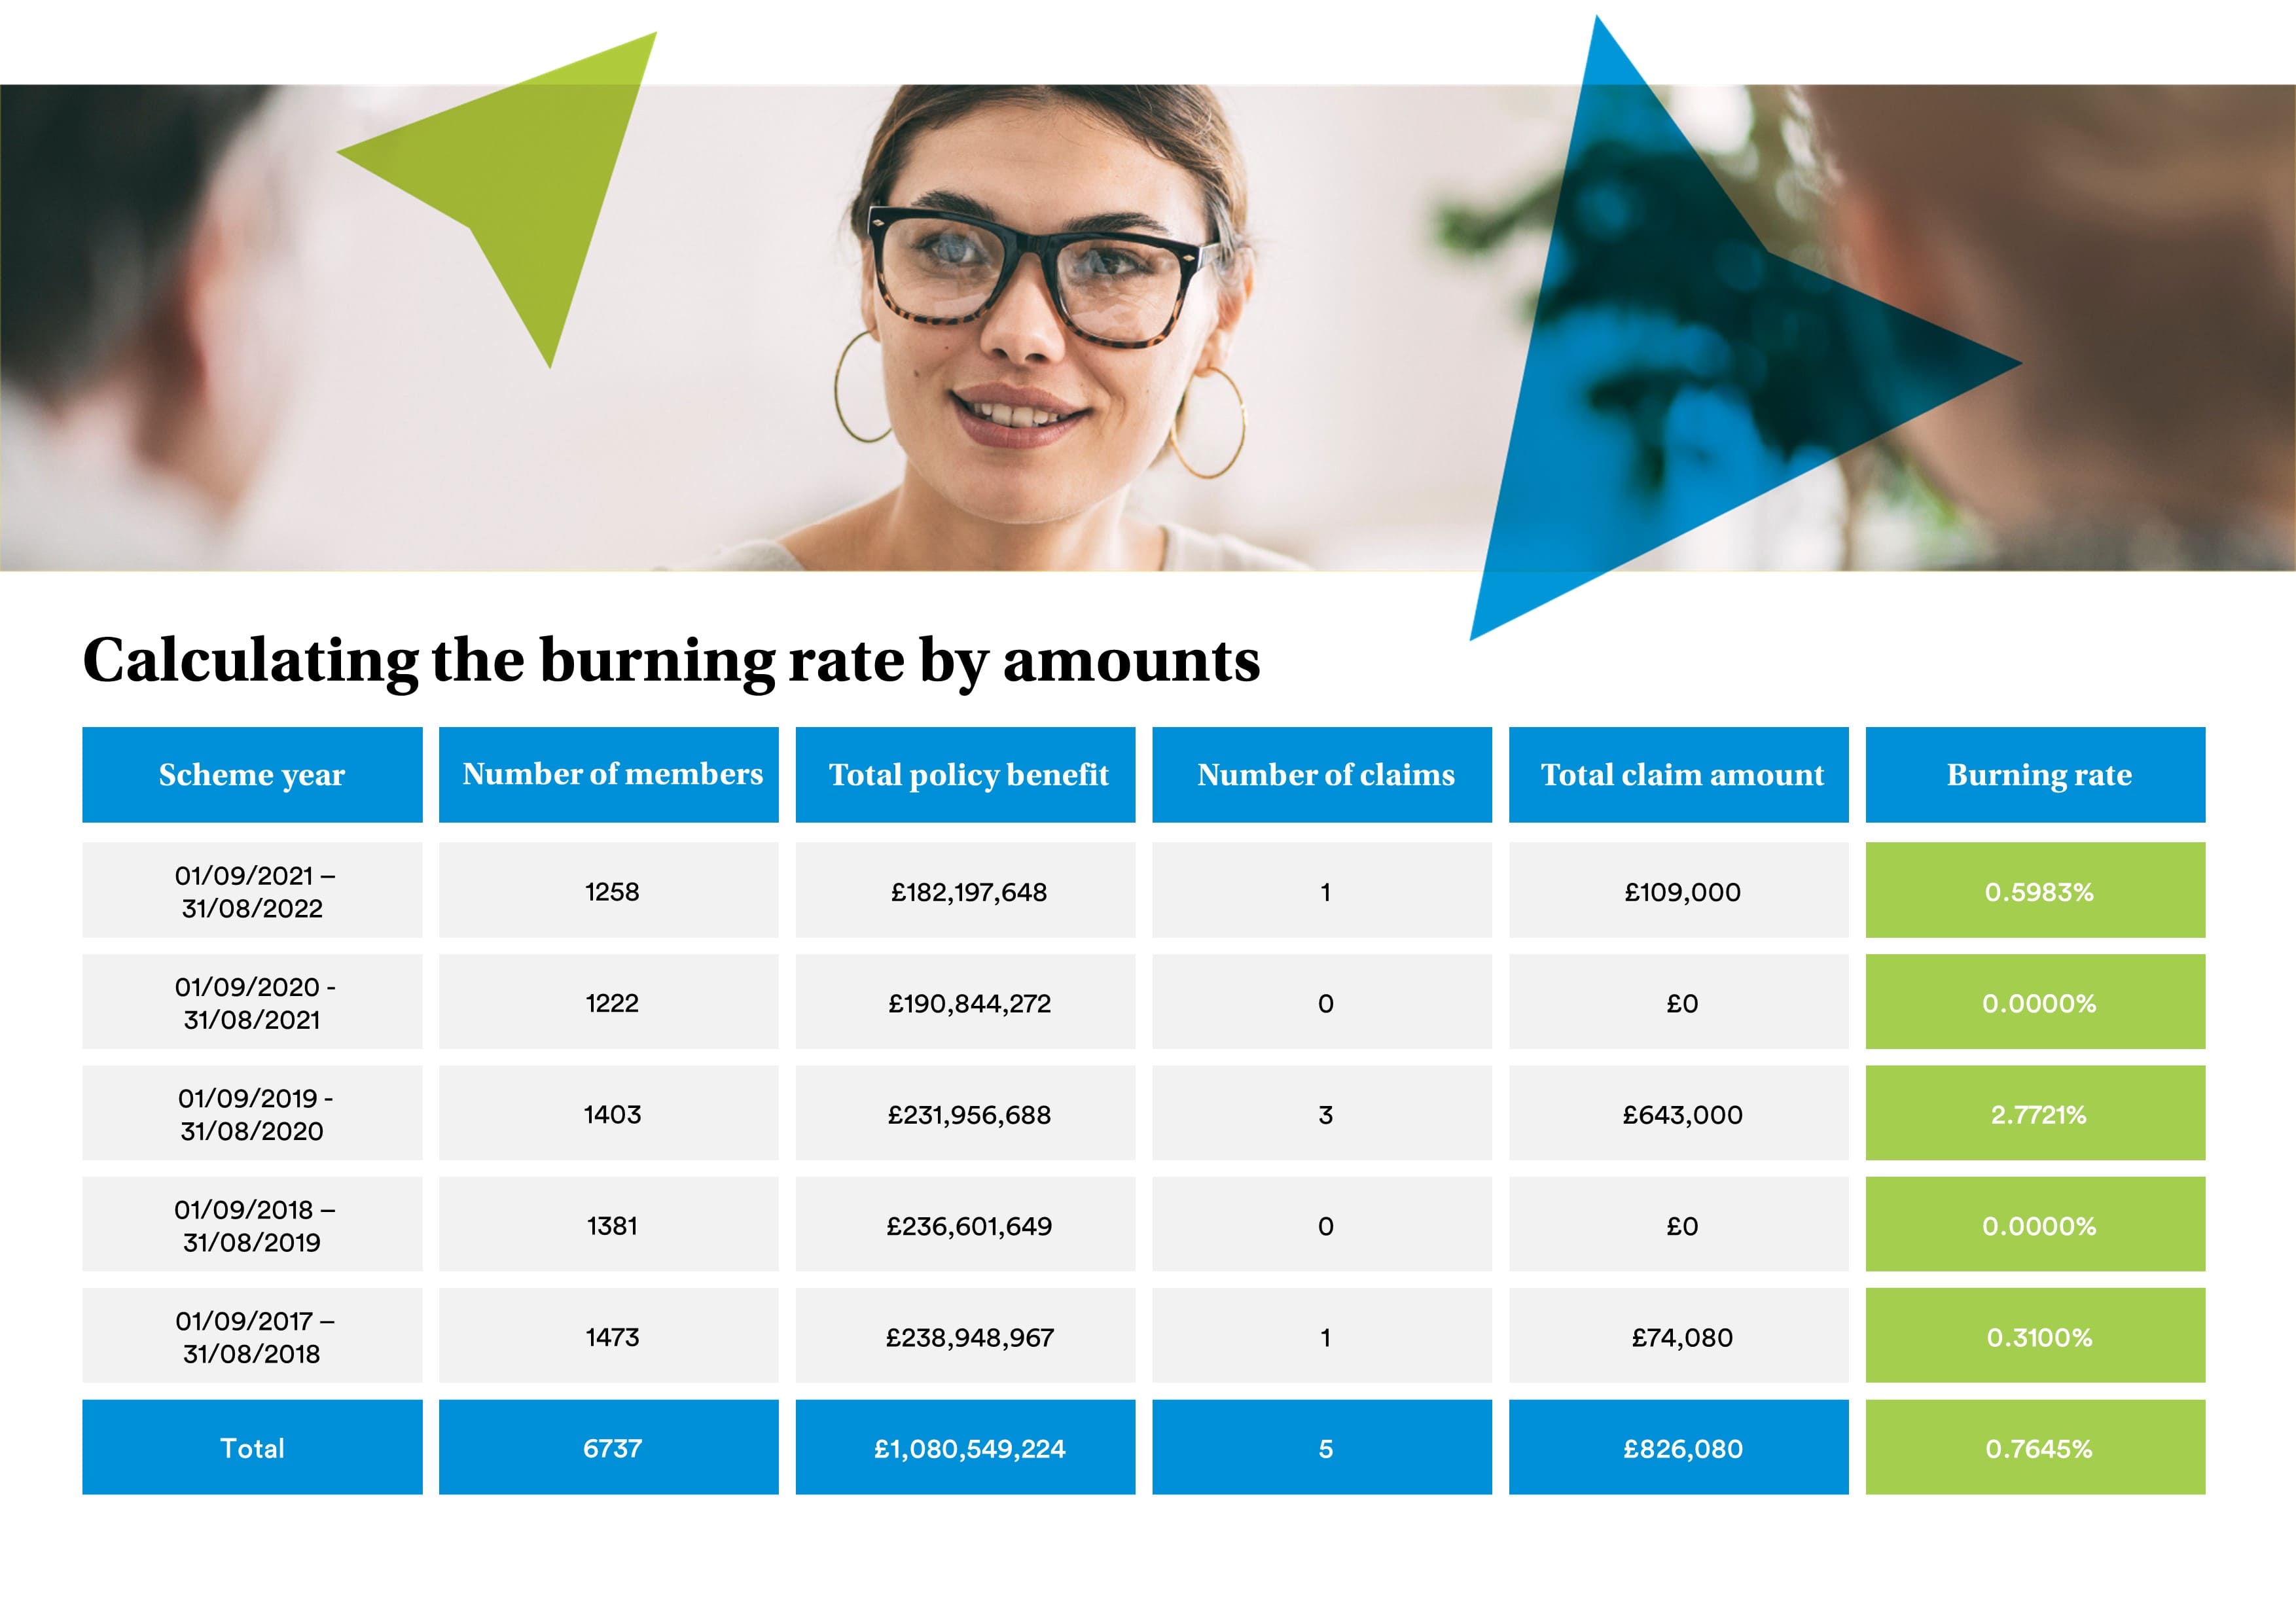
It’s useful to calculate these rates but it gets more interesting when you start to look at how an organisation’s life insurance has performed over a longer – ideally five year – period.
The total claim amount has fluctuated from year to year, with two years claims-free.
This means the burn rate has also fluctuated.
In the most recent year – 2021/22 – it was £0.5983‰, but in 2020/21 and 2018/19, when there were no claims, it was £0.0000‰.
In 2019/20, more claims were paid – £643,000 over three claims – but the total policy benefit was consistent so the burn rate increased to £2.7721‰.
In 2017/18, a lower value claim was paid – £74,080 – so the burn rate was lower at £0.3100‰.
Pricing projections
Taking this five-year view can give insight into how the organisation’s life insurance has performed and how it might be priced in the future.
Five years is the market standard for these calculations. Shorter, and it’s not long enough to show any trends; longer and other factors such as changes in the company, or its employees or other external factors can start to distort the data (how relevant will covid claims be in 5 years time for example).
In this example, claims have been consistently low with a spike in 2019/20 when the total claim amount increased to £643,000. This could be an anomaly, which will drop off the table in three years’ time, bringing the unit rate down.
Managing expectations
Calculating burn rates can help to inform the advice provided to organisations. Seeing a burn rate increase is an indication that the cost of cover is set to rise to reflect the worsening claims performance.
Sharing this insight with an employer can help to manage their expectations – and budget.
Where this happens, it is also an opportunity for an adviser to look at claims to see whether there is anything they could do to reverse the trend. For example, if claims analysis shows that cardiovascular disease is a leading cause of claims, it may be worth recommending health screening and/or a health and wellbeing programme focusing on heart health.


