Adding Value
How to calculate a basic premium for employee benefits
Mar 20, 2020
Adding Value
How much an organisation pays for its employee benefits is based on actuarial calculations on risk. Knowing which factors affect these calculations can help manage client expectations.
Every insurer has its own set of base rates for group risk products. These are based on their assumptions on the likelihood of a claim, with rates varying by age and gender.
Insurers will use different mortality and morbidity studies as well as their own claims experience and views on risk to determine these rates.
For group life, insurers are assessing the risk of a member dying. Although the mortality risk is slightly higher in a member’s late teens, it then drops off and stabilises through their twenties before starting to increase once they reach their fifties. It then rises sharply as the risk of mortality increases.
Rates are also affected by gender. As males have a higher mortality risk, their rates are higher than those for females of the same age.
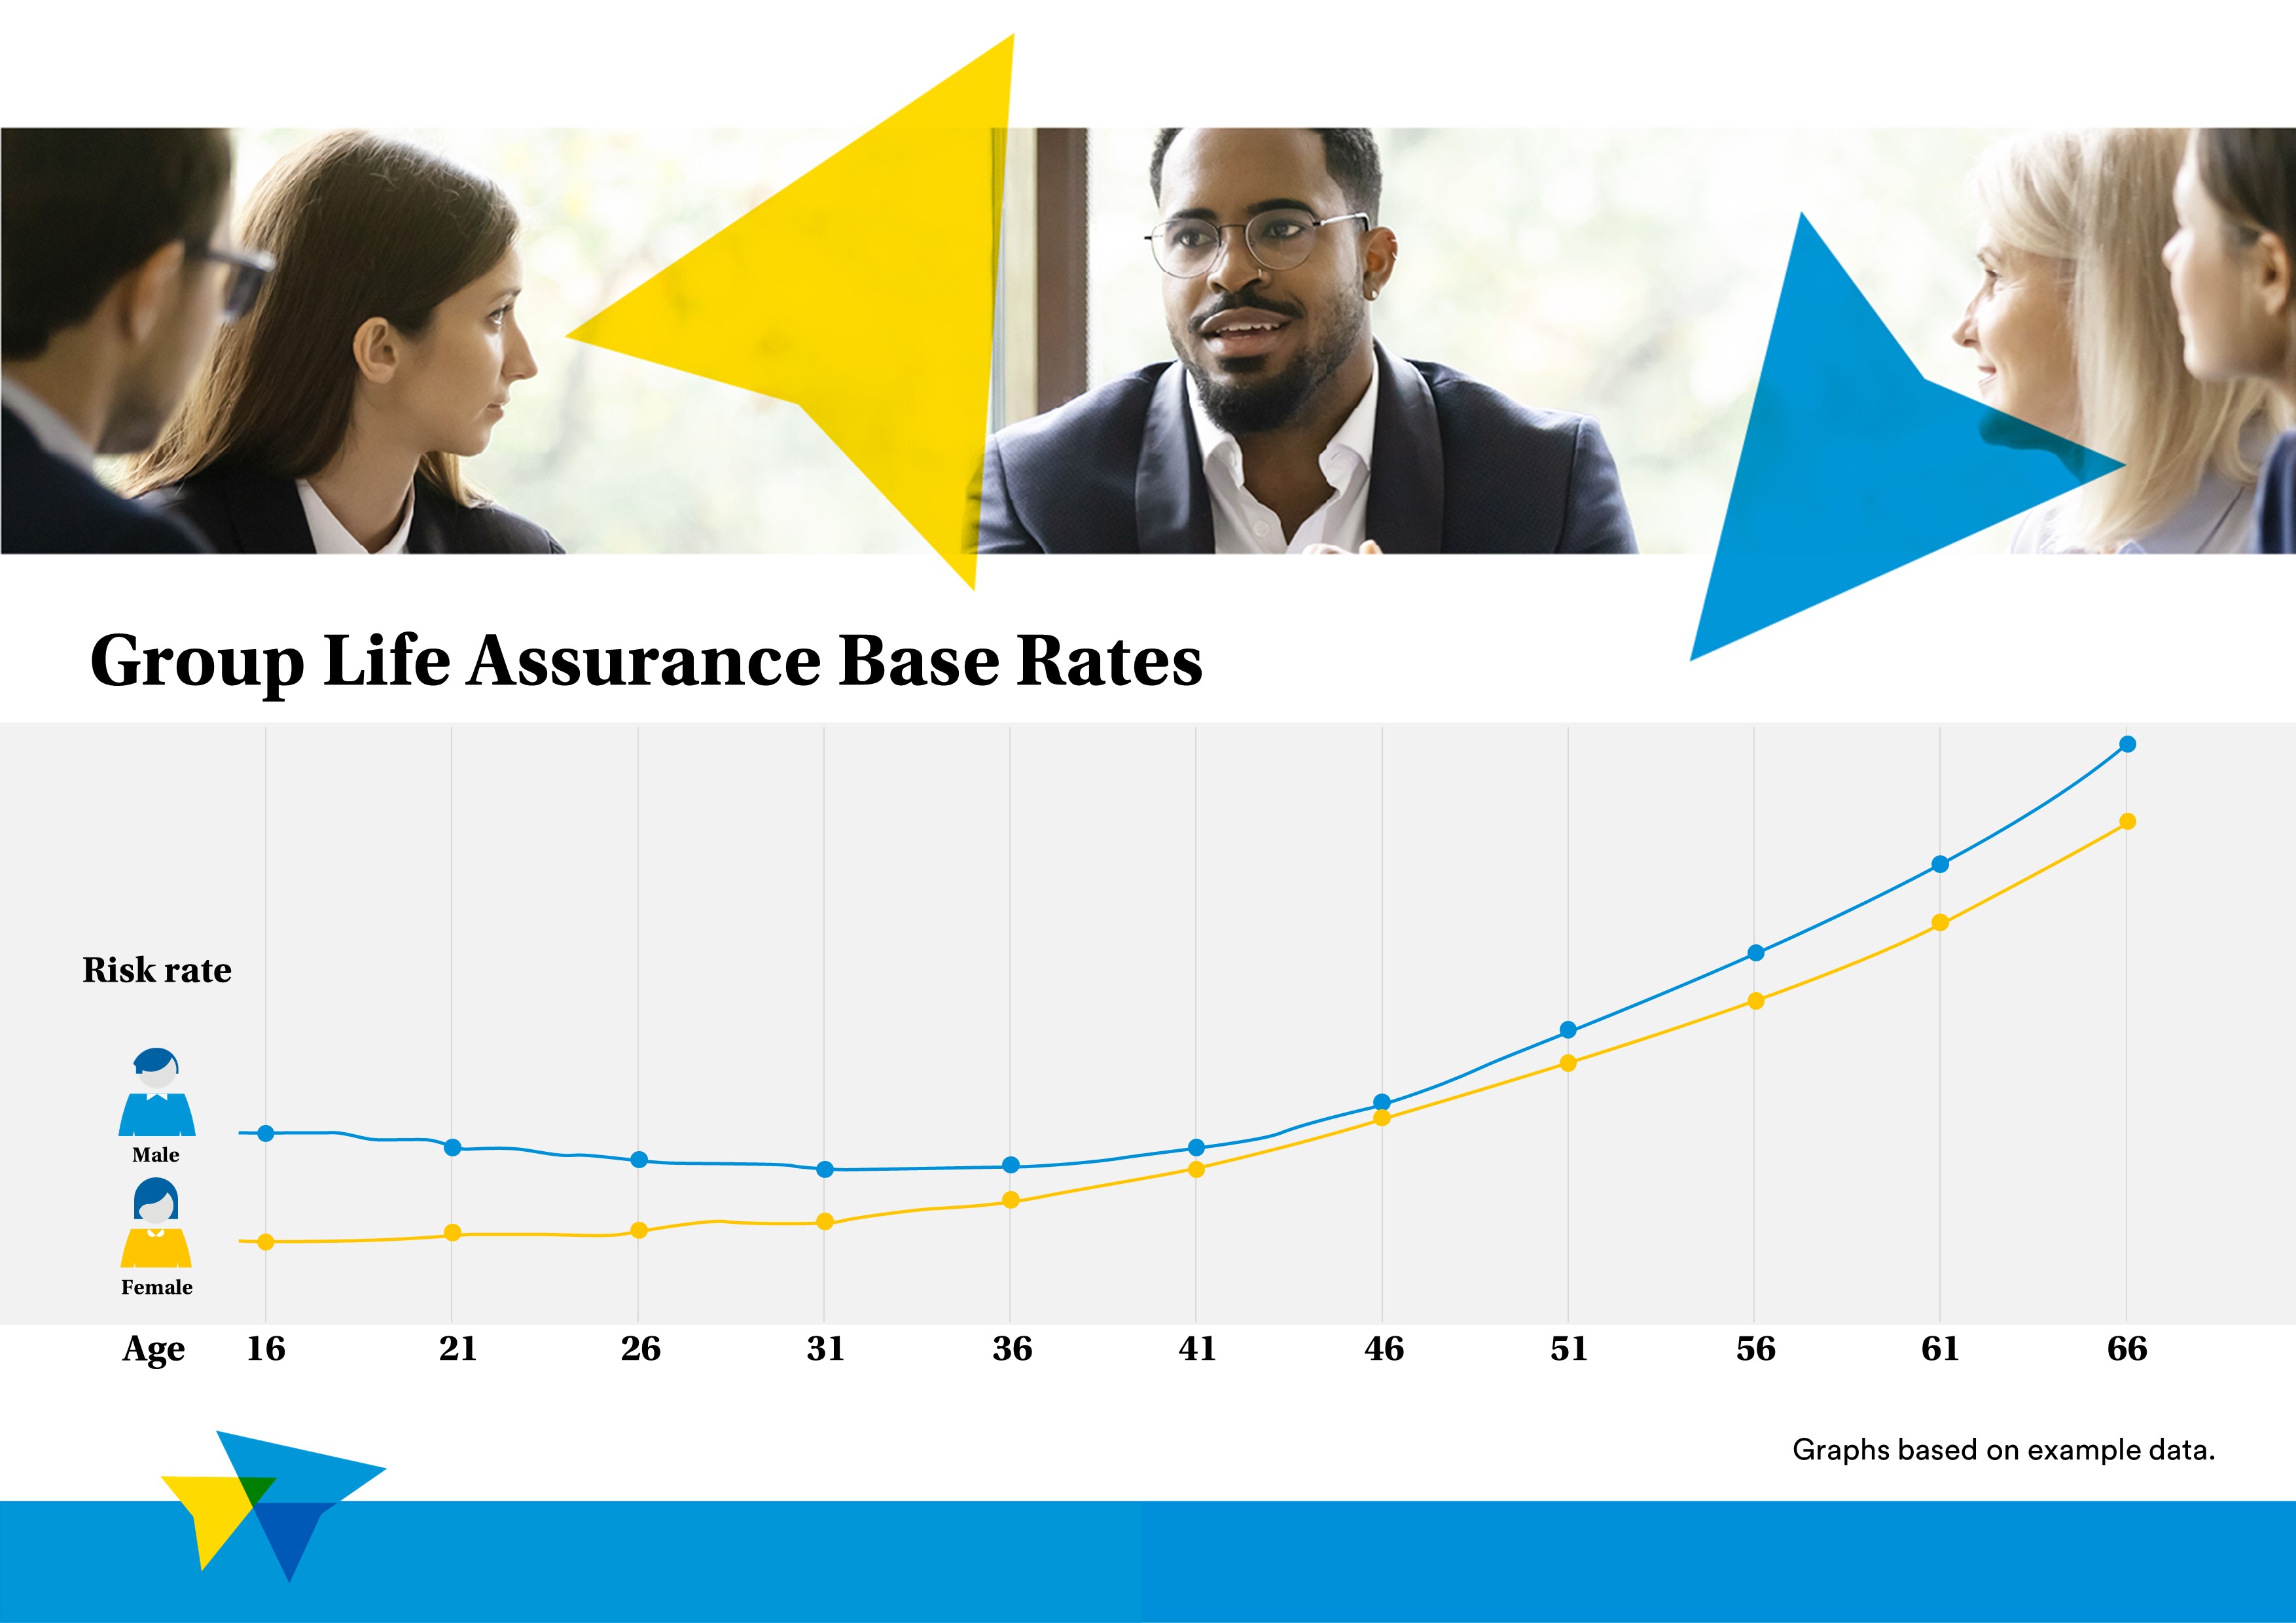
Plotted on a graph, with the x axis age and the y axis the risk rate, group life rates resemble a hockey stick.
With group income protection, insurers are looking at two different factors when it comes to determining rates. First, they need to determine the likelihood of a member developing a long-term illness or injury that prevents them from working. This is known as the morbidity risk.
In addition, they must also look at the potential size of the claim, especially where a policy pays until state pension age.
This creates a very different graph to the group life one.
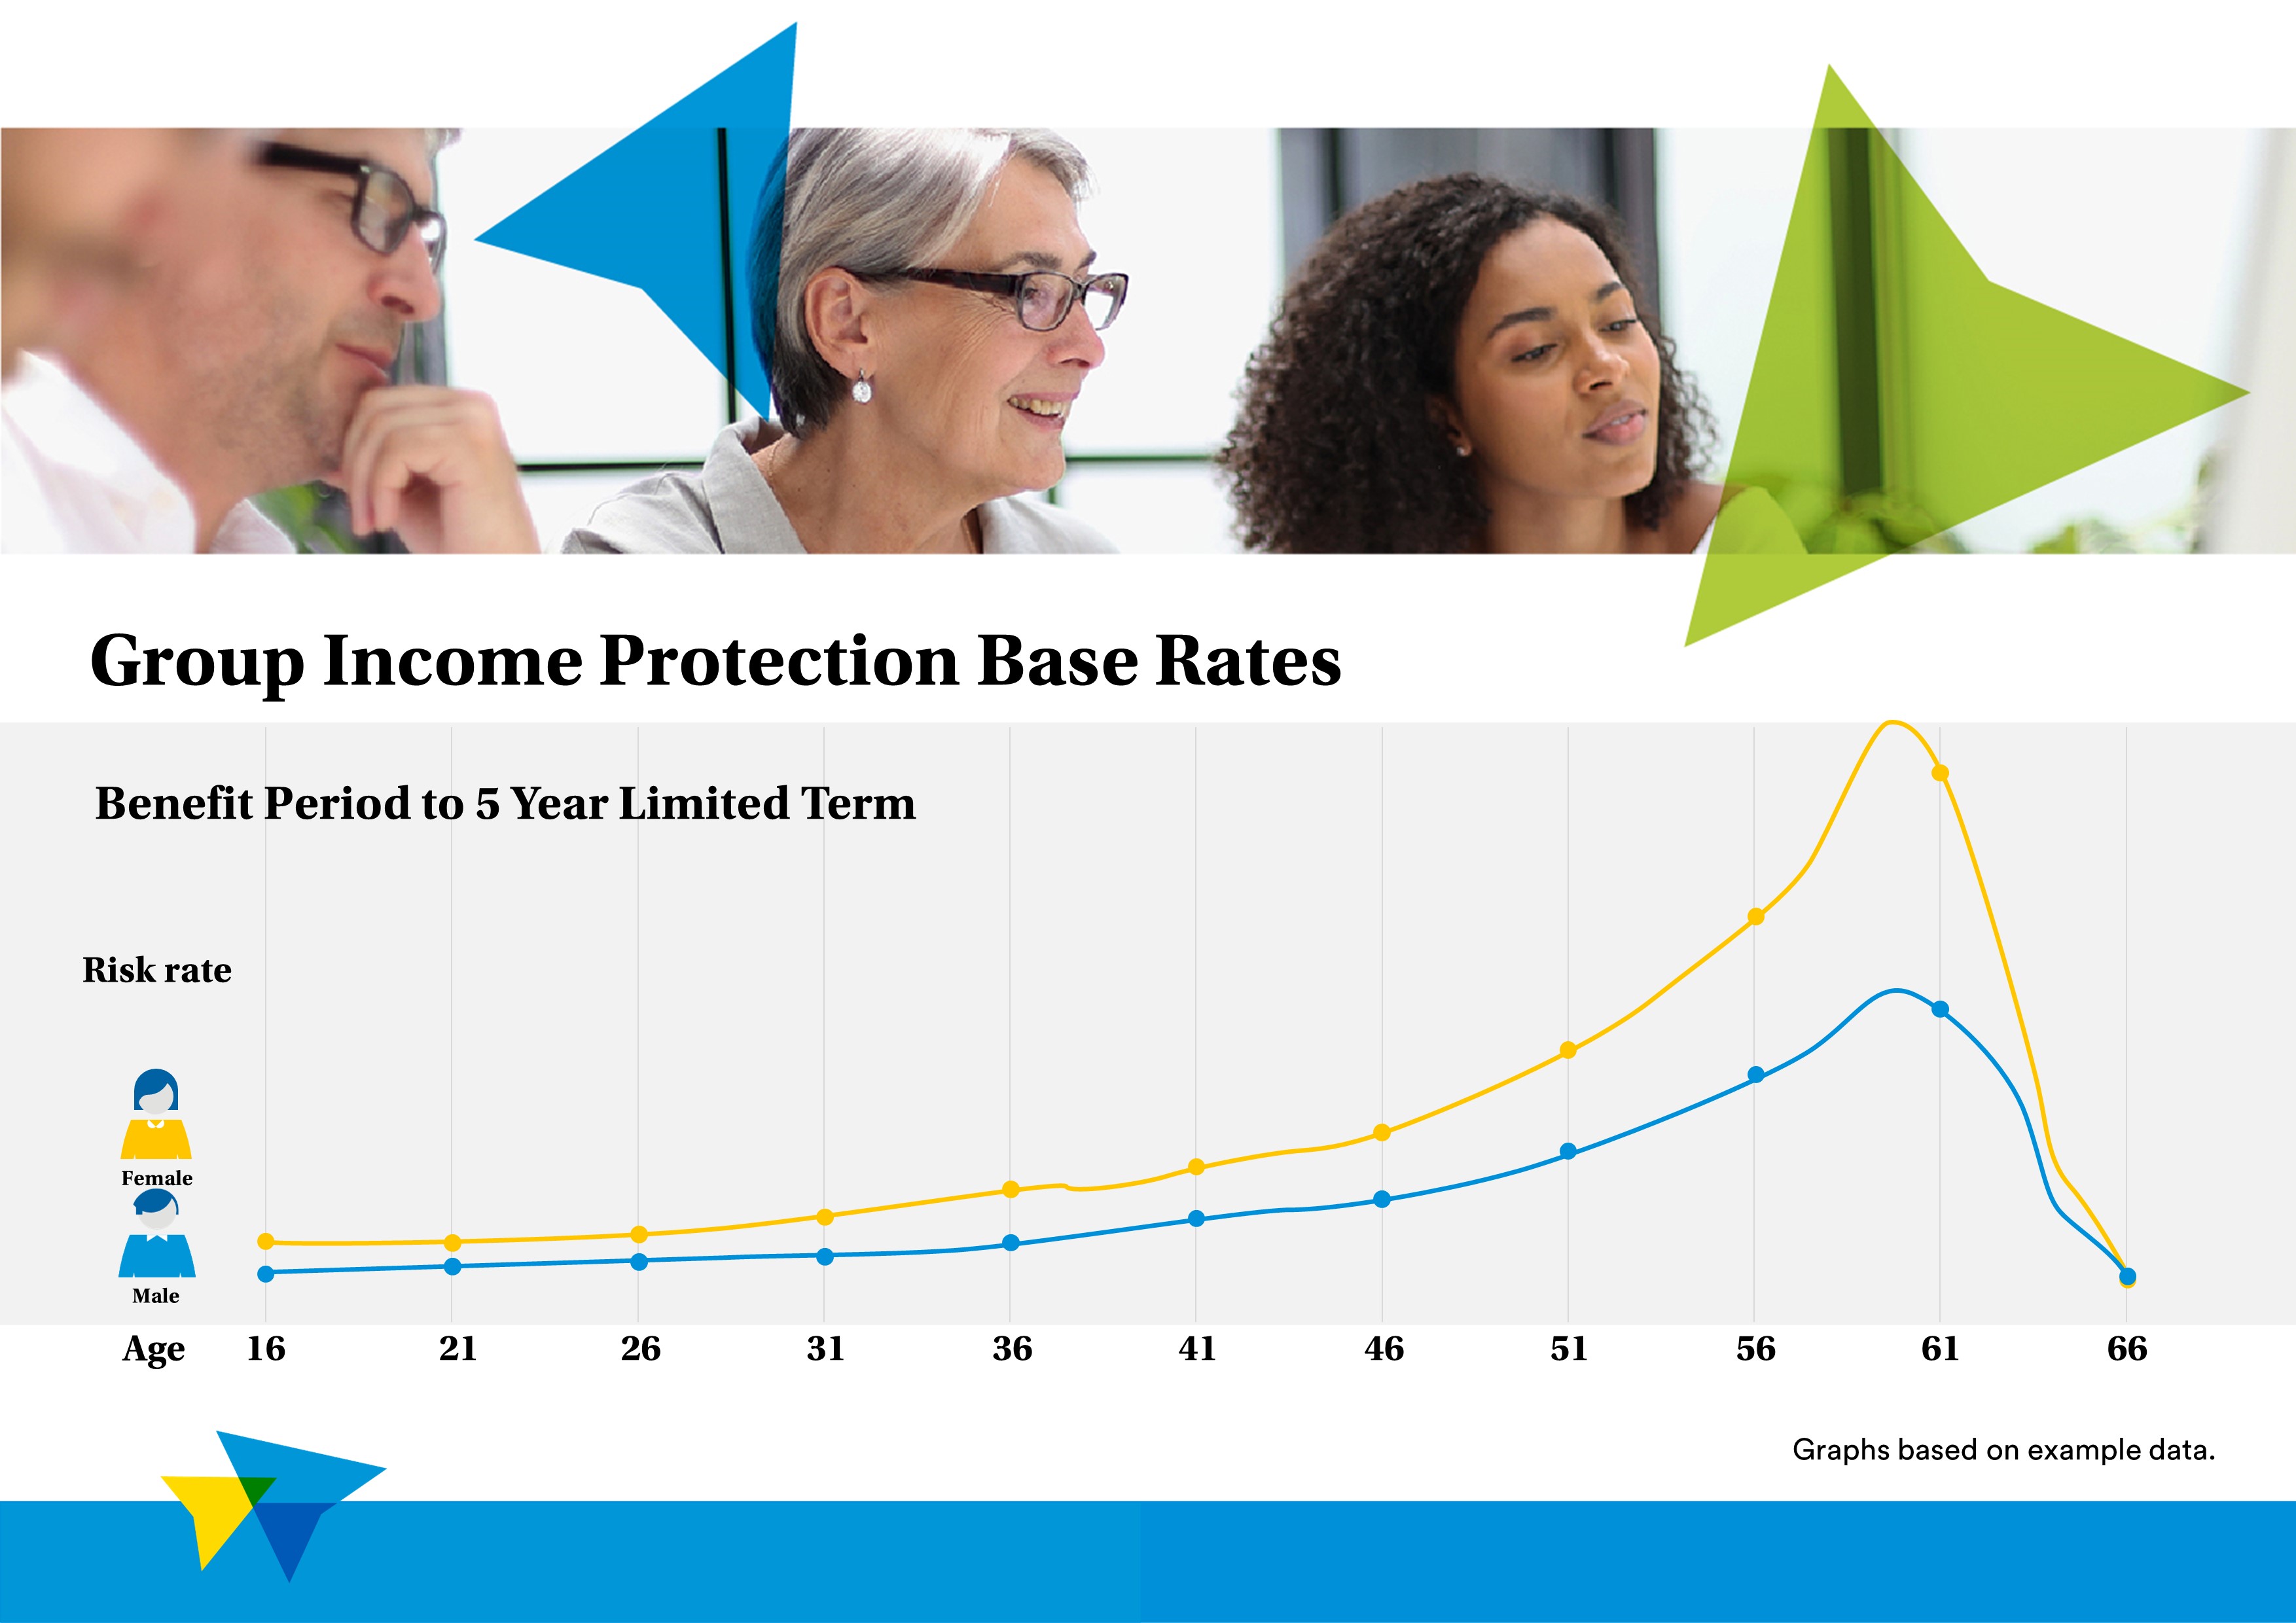
Although the risk of a member making a claim increases with age, the size of the potential claims payment also reduces with age. As a result, rates start to fall as a member’s age approaches state pension age and the potential claim size is limited.
Female rates also tend to be slightly higher than male rates on group income protection. This is because they are more likely to suffer an illness or injury that prevents them from working long-term.
To calculate the base rate for an organisation, an insurer would take the rate for each member and multiply it by the benefit level they have, to get their base rates.
Every member’s base rate is then added up to achieve a rate for the policy. Therefore, although a single rate will be attributed to the organisation, it will reflect the risk presented by the individual members who will be covered by the policy.